- Overview
- Architecture
- Research and validation pipeline
- Walk-forward tracking
- Demo
- Conference poster
- Conclusions
- Future work
- References
- Acknowledgements
Overview
Cryptocurrency markets have matured rapidly over the past two years. The launch of spot-Bitcoin and spot-Ether ETFs, the entry of institutional liquidity providers, and the proliferation of quantitative funds have compressed the inefficiencies that once made discretionary “edge” easy to capture. Generating durable alpha is now substantially harder than it was even three years ago, and the cost of being unsystematic has risen accordingly.
Kadabra formalizes the research and deployment lifecycle of systematic trading strategies in a single proprietary framework, designed and implemented end-to-end by the author. It supports any trading idea operating at frequencies above one minute (no HFT) and is strategy-agnostic by design: statistical arbitrage, cross-exchange triangular arbitrage, blockchain-analytics signals, traditional finance metrics, and machine-learning models can all be expressed through the same interface and routed through the same risk and execution layers.
The motivation came from years spent producing open-source market indicators on TradingView, several of which reached the platform’s front page and put the author in conversation with industry practitioners. The conclusion from those conversations was unambiguous: in a maturing market a systematic approach is no longer a preference — it is a requirement. Anything else is gambling.
Architecture
Kadabra is split into two cooperating subsystems: an always-on live execution engine and an offline research and validation pipeline. The live engine consumes real-time market data, materializes features at each timeframe boundary, asks the strategy for a discrete signal, and routes a two-phase order through a recovery-aware executor. The research pipeline operates strictly offline; it ingests historical data, runs parameter searches, and gates promotion of any candidate strategy through a multi-test robustness bar.
Live execution
WebSocket streams from Binance and Hyperliquid feed a thread-safe
LiveDataCache and a numpy-backed OHLCVRingBuffer with O(1) appends.
At each timeframe boundary, a DataPipeline produces features (TA
indicators, fractional differencing, market-structure metrics), the
strategy emits a discrete signal in {−4, …, +4}, and a two-phase order
executor places the trade.
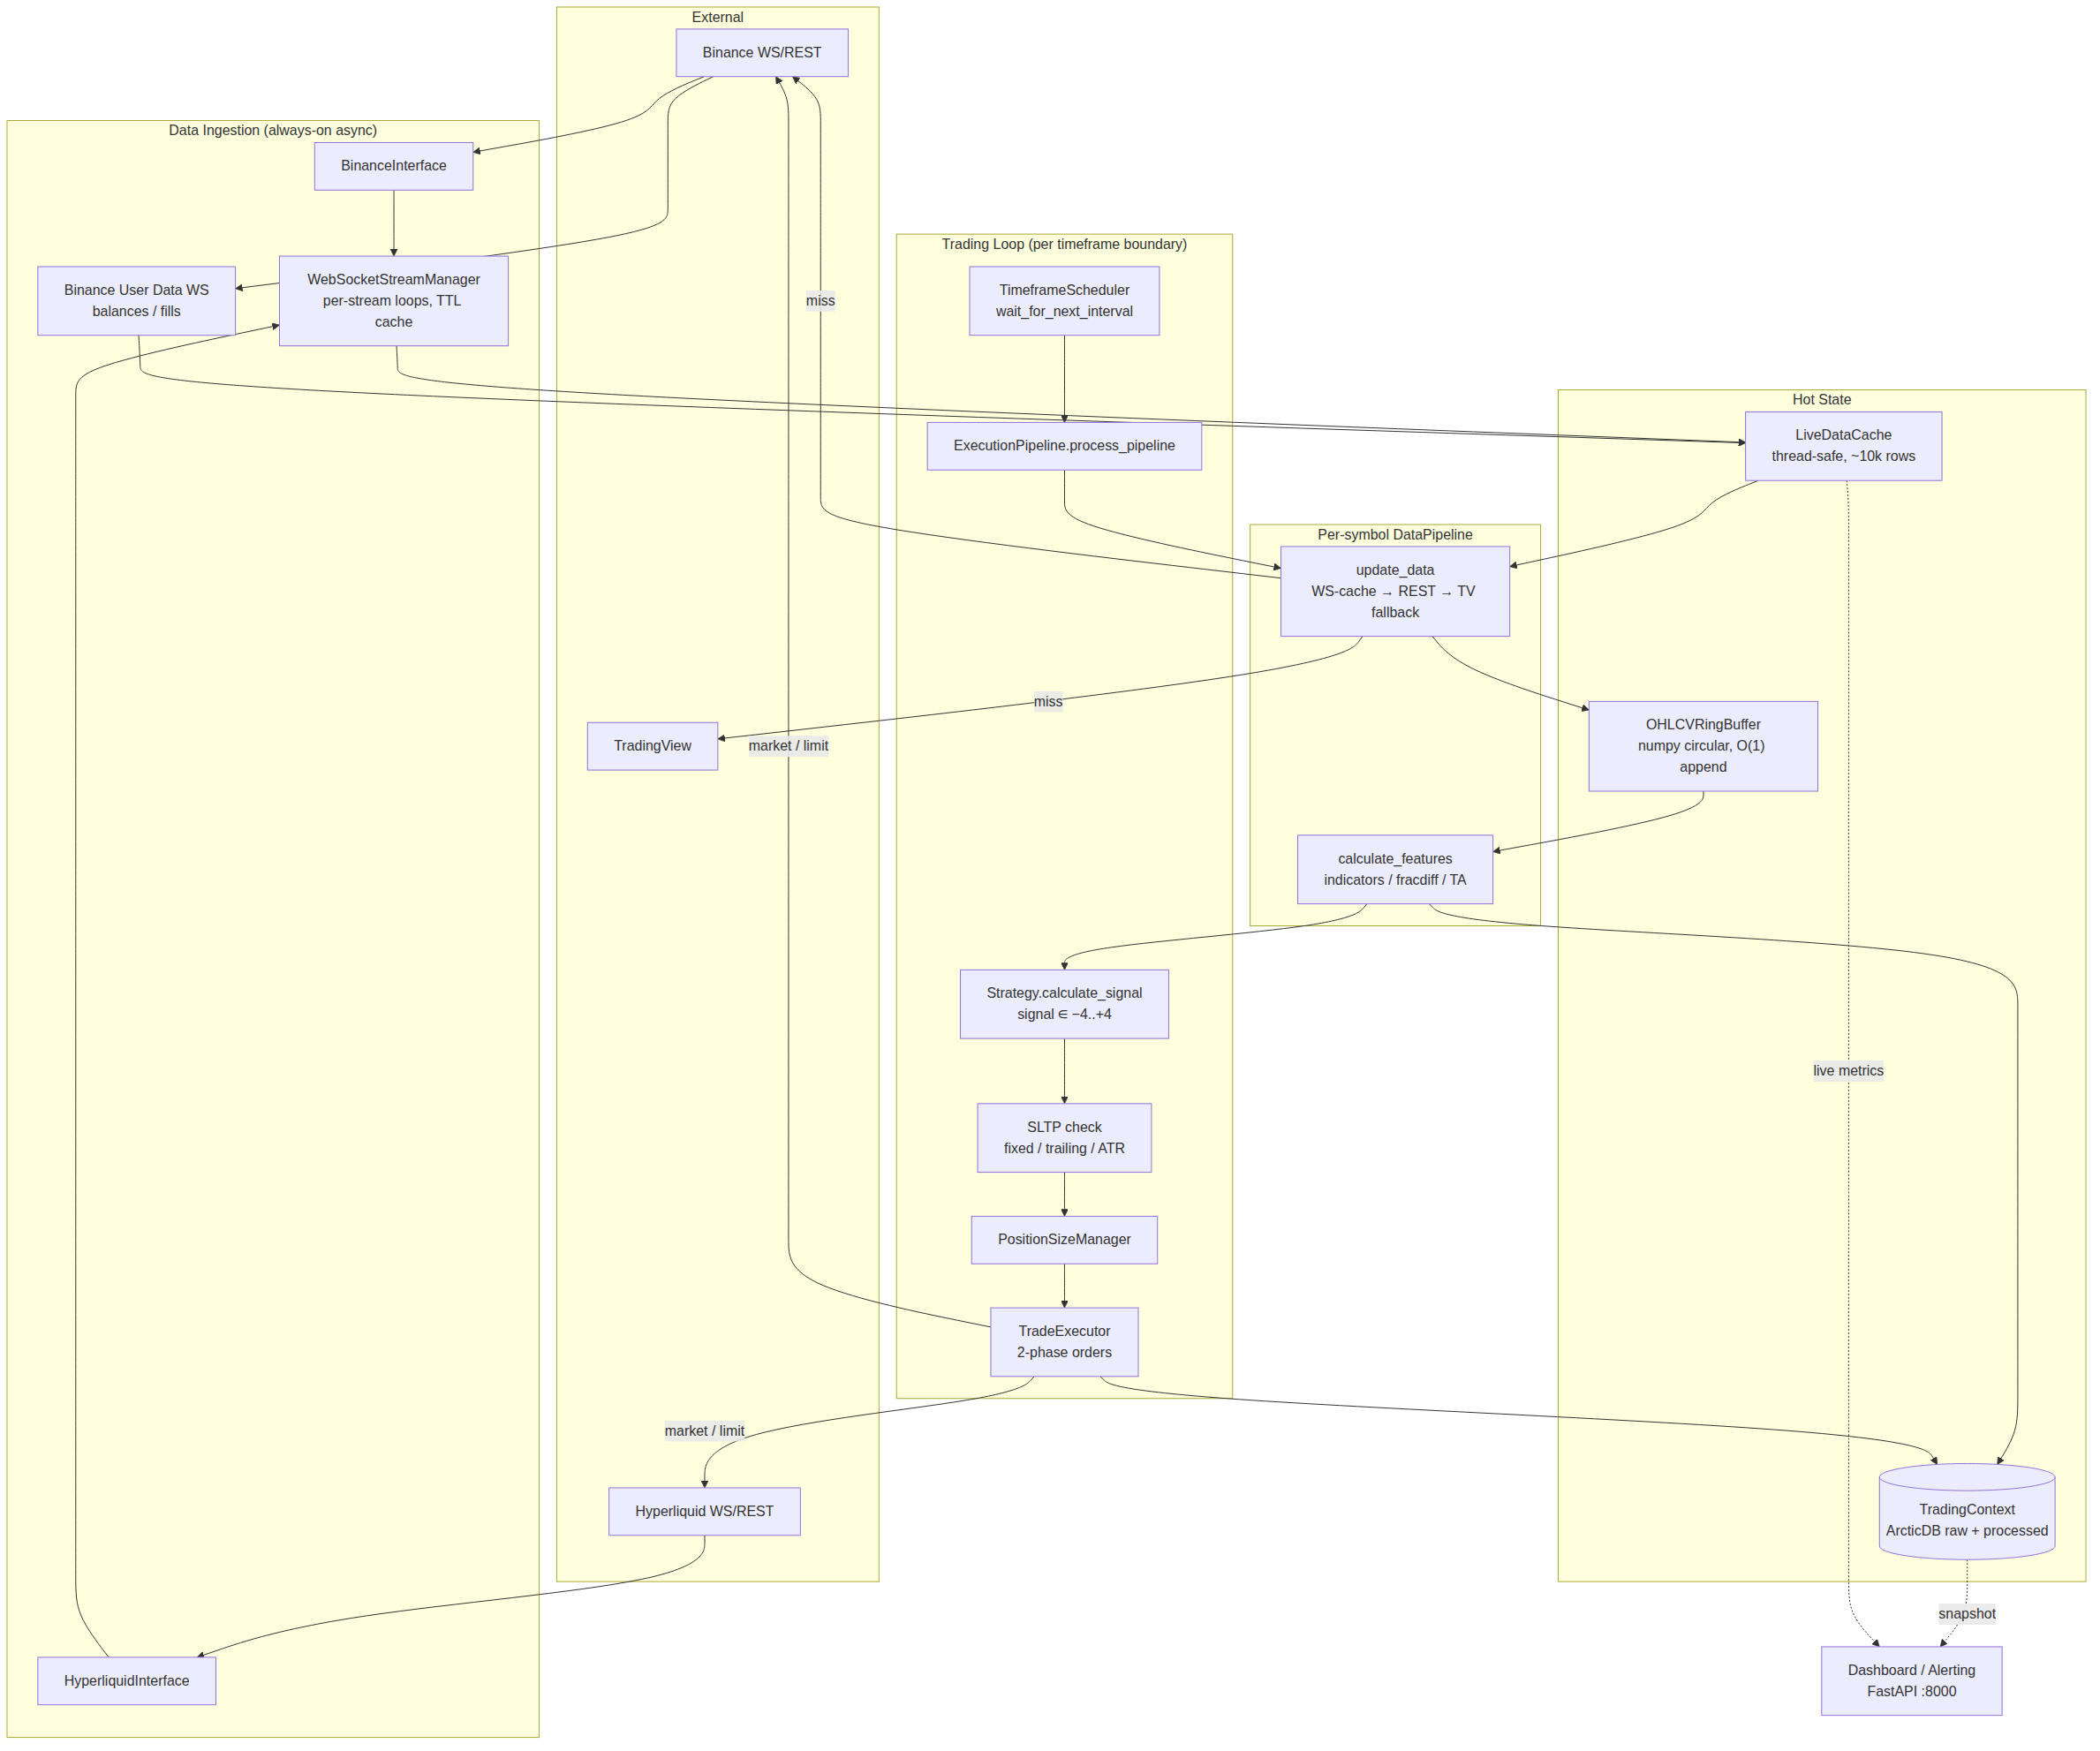
Async data ingestion (Binance + Hyperliquid WS/REST) feeds a thread-safe LiveDataCache and an OHLCVRingBuffer. At each timeframe boundary the trading loop runs update_data → calculate_features → Strategy.calculate_signal → SLTP → PositionSizeManager → TradeExecutor, with snapshots persisted to ArcticDB and surfaced via a FastAPI dashboard.
Failure recovery
Failure handling is explicit, not ad-hoc. A 150-error-code Binance error map classifies every API response into RETRIABLE, RECOVERABLE, UNCERTAIN, or FATAL categories, each with a corresponding recovery path. The executor never assumes silent success — every transition through the order state machine is verified against exchange ground truth.
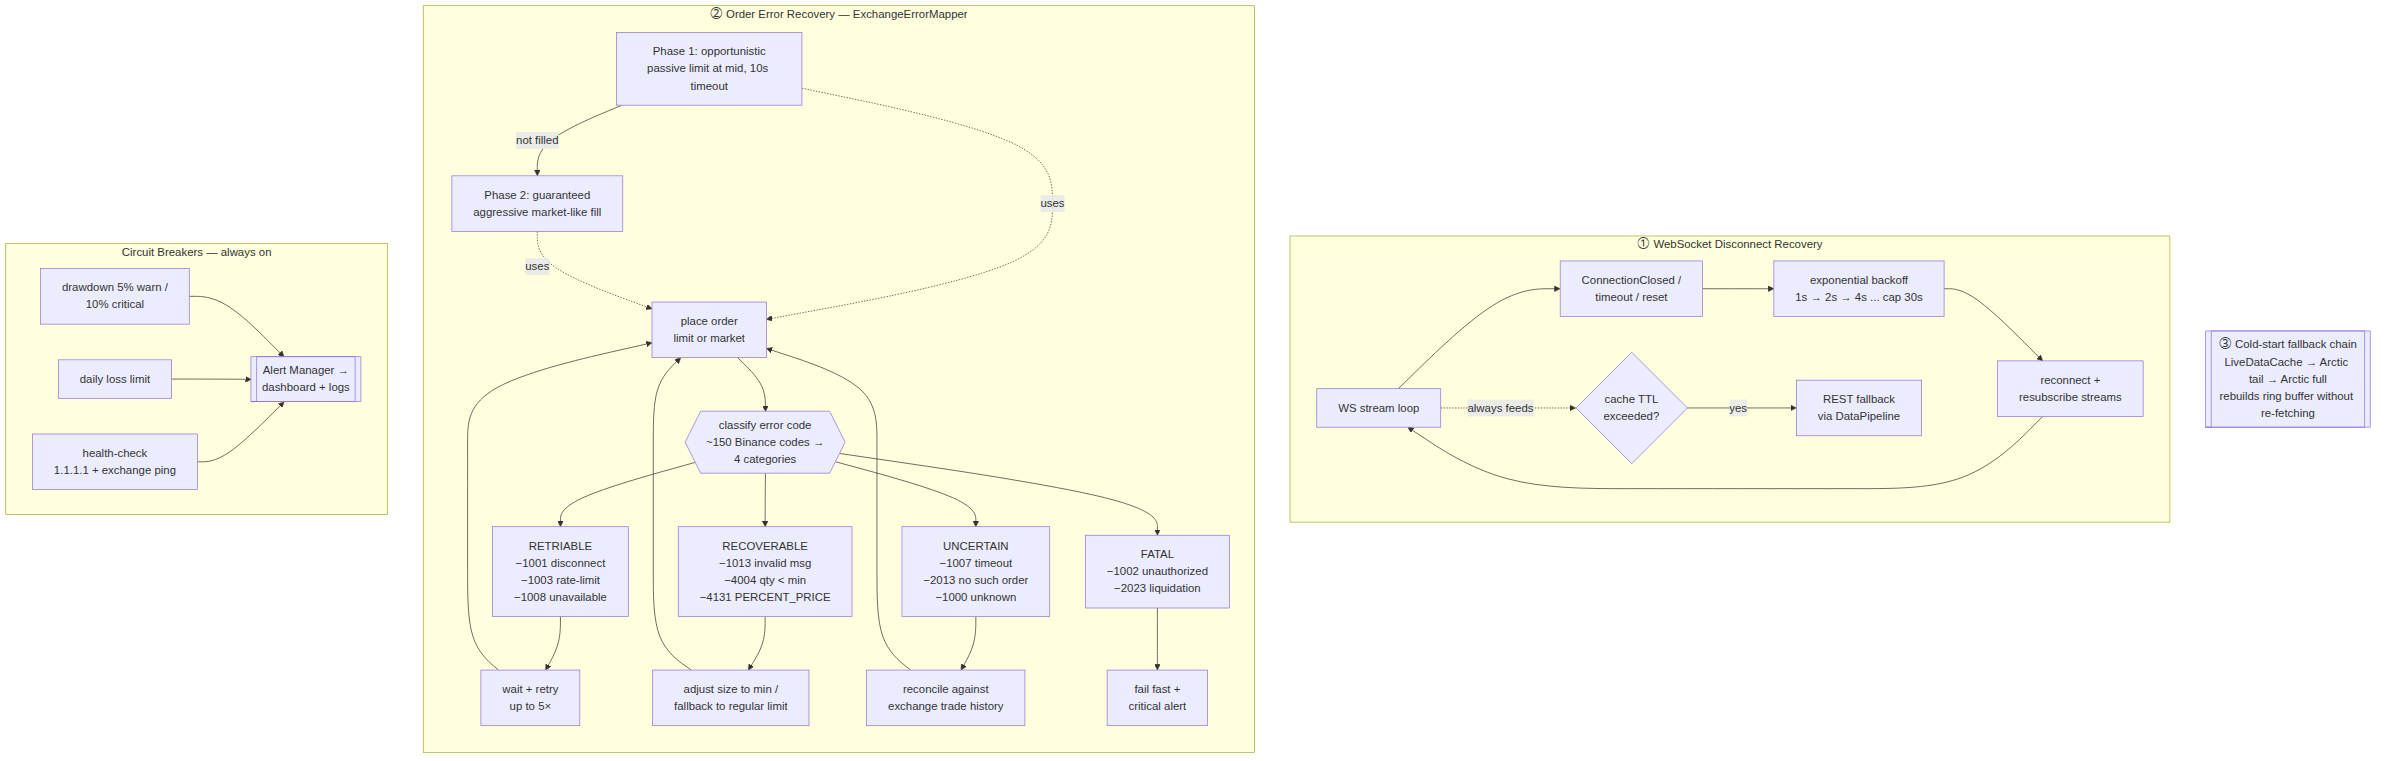
Three coordinated recovery mechanisms: WebSocket disconnect with exponential backoff (capped at 30s) and a cold-start fallback chain on the data side; a two-phase order placement (passive limit at mid → aggressive market-like) on the execution side; and an ExchangeErrorMapper that classifies ~150 Binance error codes into four categories — RETRIABLE, RECOVERABLE, UNCERTAIN, FATAL — each with a specific action.
Research and validation pipeline
A strategy candidate must clear a multi-test robustness gate before promotion to live trading. The gate combines four independent checks, each targeting a different failure mode of naive backtesting.
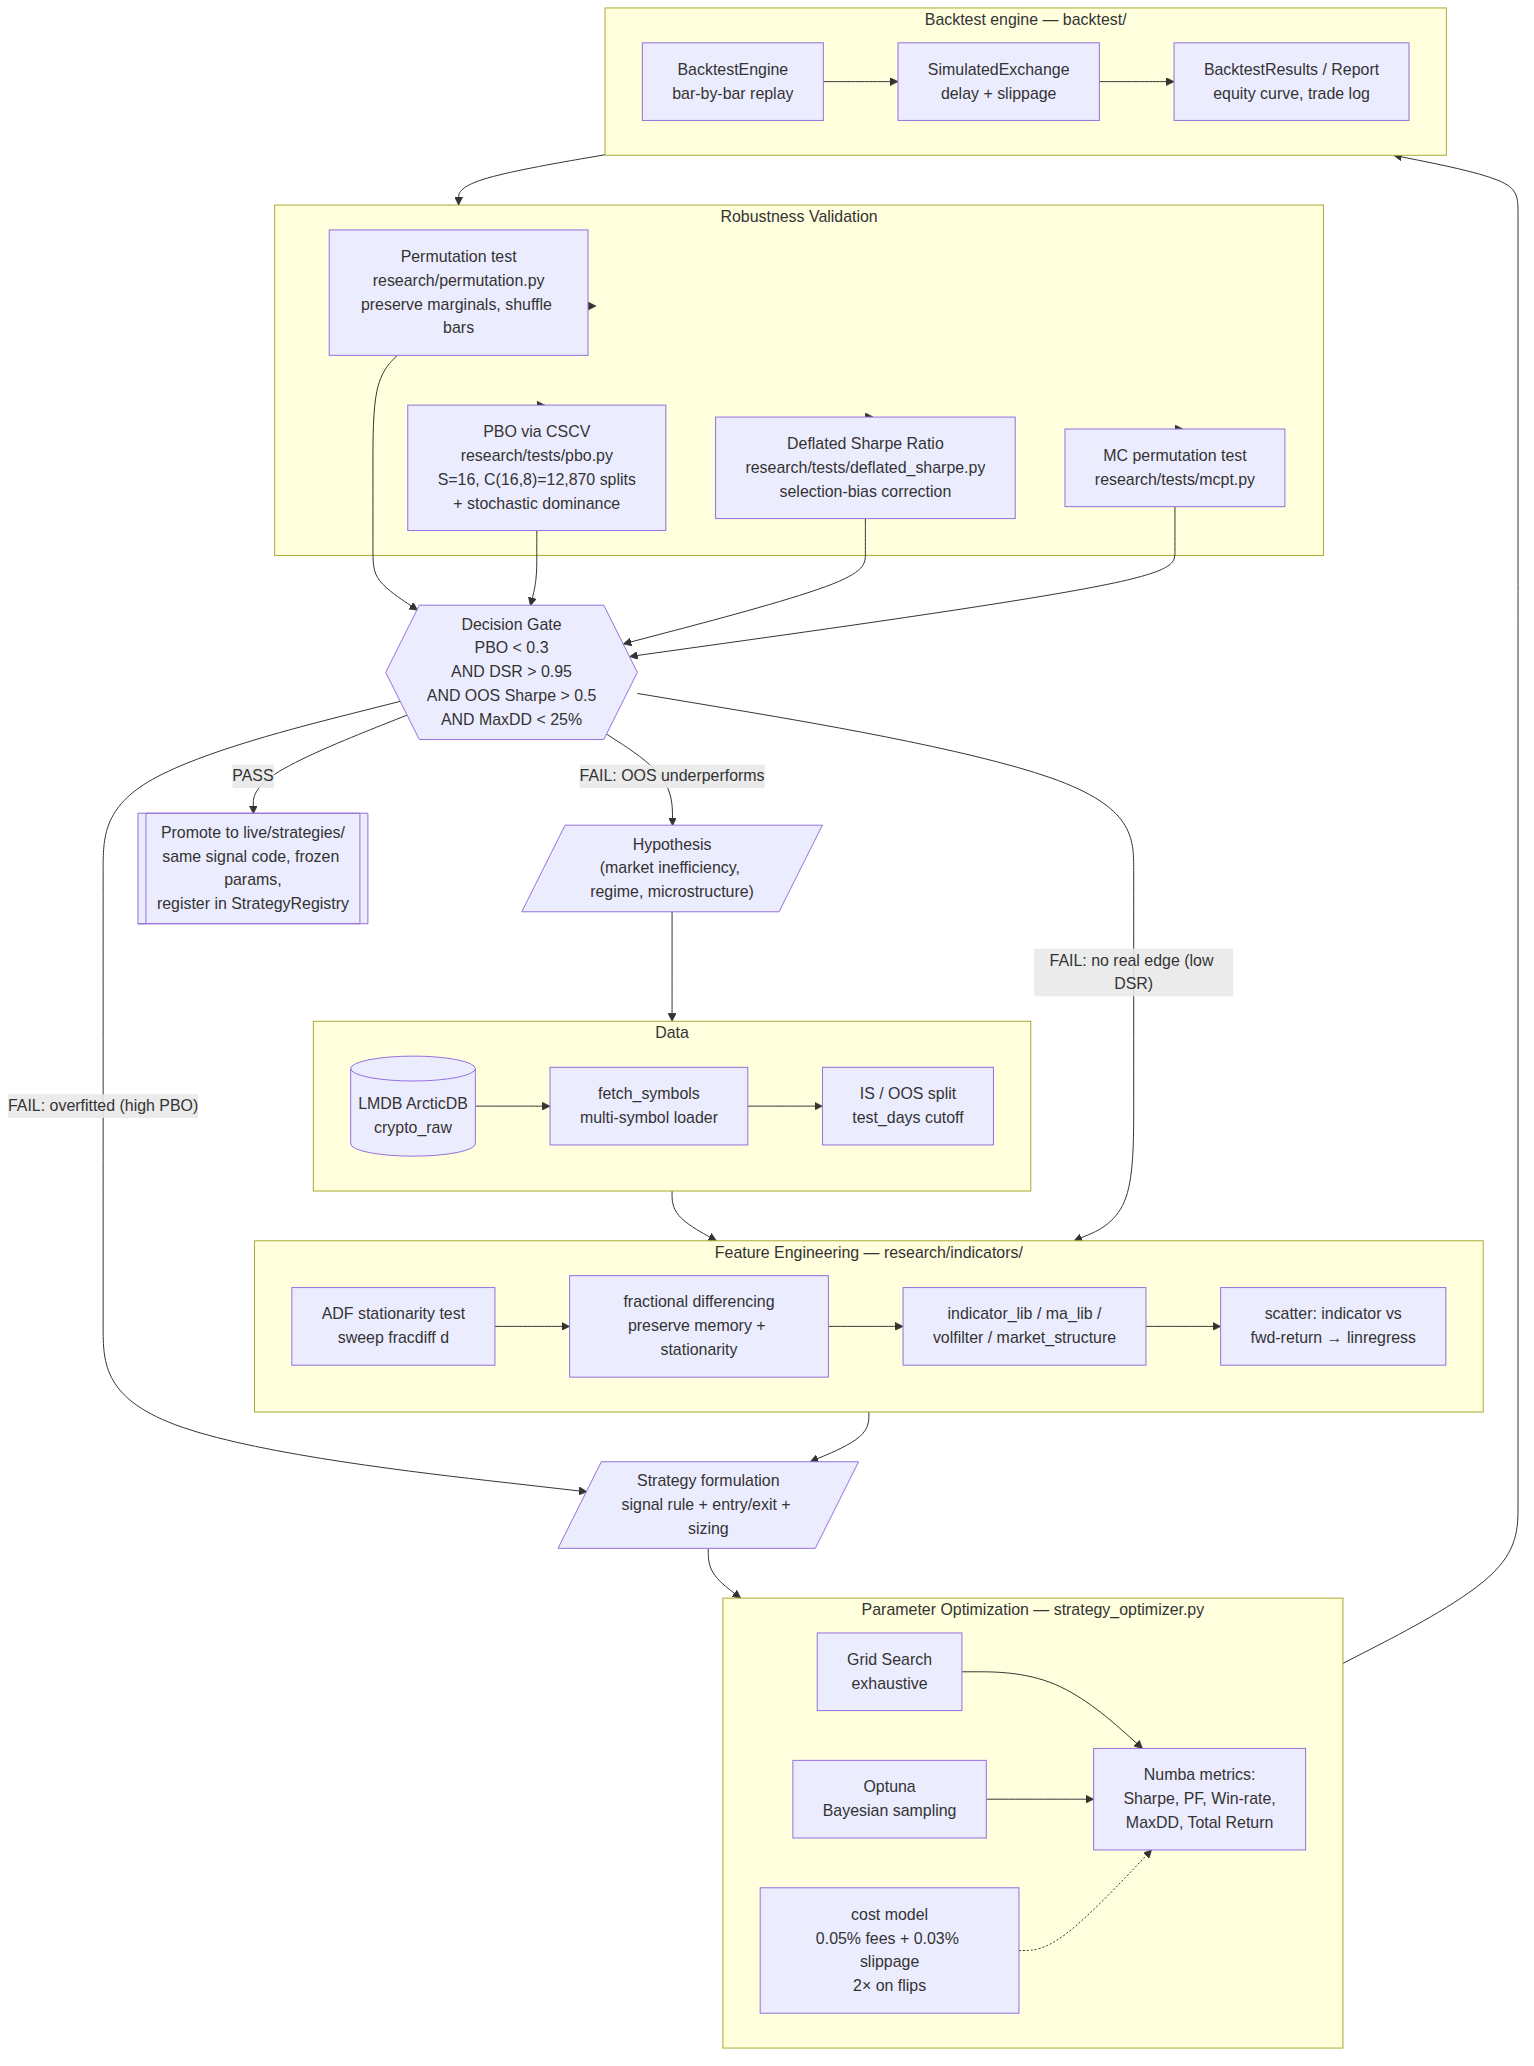
Hypothesis → data load (LMDB ArcticDB, IS/OOS split) → feature engineering (ADF, fracdiff, indicator libs) → strategy formulation → parameter optimization (Grid + Optuna with Numba metrics) → backtest (SimulatedExchange with delay + slippage) → robustness validation (Permutation, PBO, DSR, MCPT). The decision gate enforces all four constraints simultaneously: PBO < 0.30, DSR > 0.95, OOS Sharpe > 0.50, MaxDD < 25%. Failure routes back to a specific stage of the loop depending on which test failed.
Parameter optimization
Candidates are produced by a parameter-search stage that combines exhaustive grid search with Bayesian sampling (Optuna). Each trial runs a full backtest under the cost model and records Sharpe, profit factor, win rate, max drawdown, and total return — all computed under Numba for throughput. The output is a population of candidate parameter sets, each with a full backtest equity curve, ready for the robustness gate.
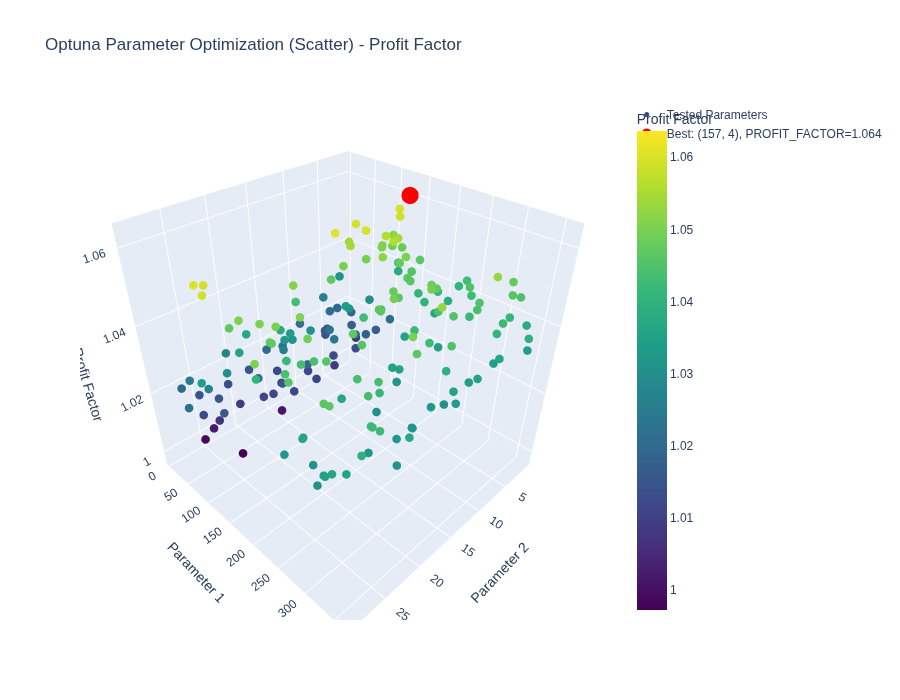
3D parameter sweep for the stablecoin strategy across 196 trials. The best candidate (red, top of the cloud) reaches profit factor ≈ 1.06. That headline number alone is not enough to clear the gate — the next four tests interrogate whether it survives selection bias, partition robustness, and randomization.
Probability of Backtest Overfitting (PBO)
Following Bailey & López de Prado (2014), the in-sample/out-of-sample data is split into S = 16 contiguous chunks. Every \(\binom{16}{8} = 12{,}870\) partition is evaluated, and PBO is the fraction of partitions in which the in-sample winner underperforms out-of-sample. Lower is better — a high PBO is a direct signal that the optimization process is selecting for noise rather than signal.
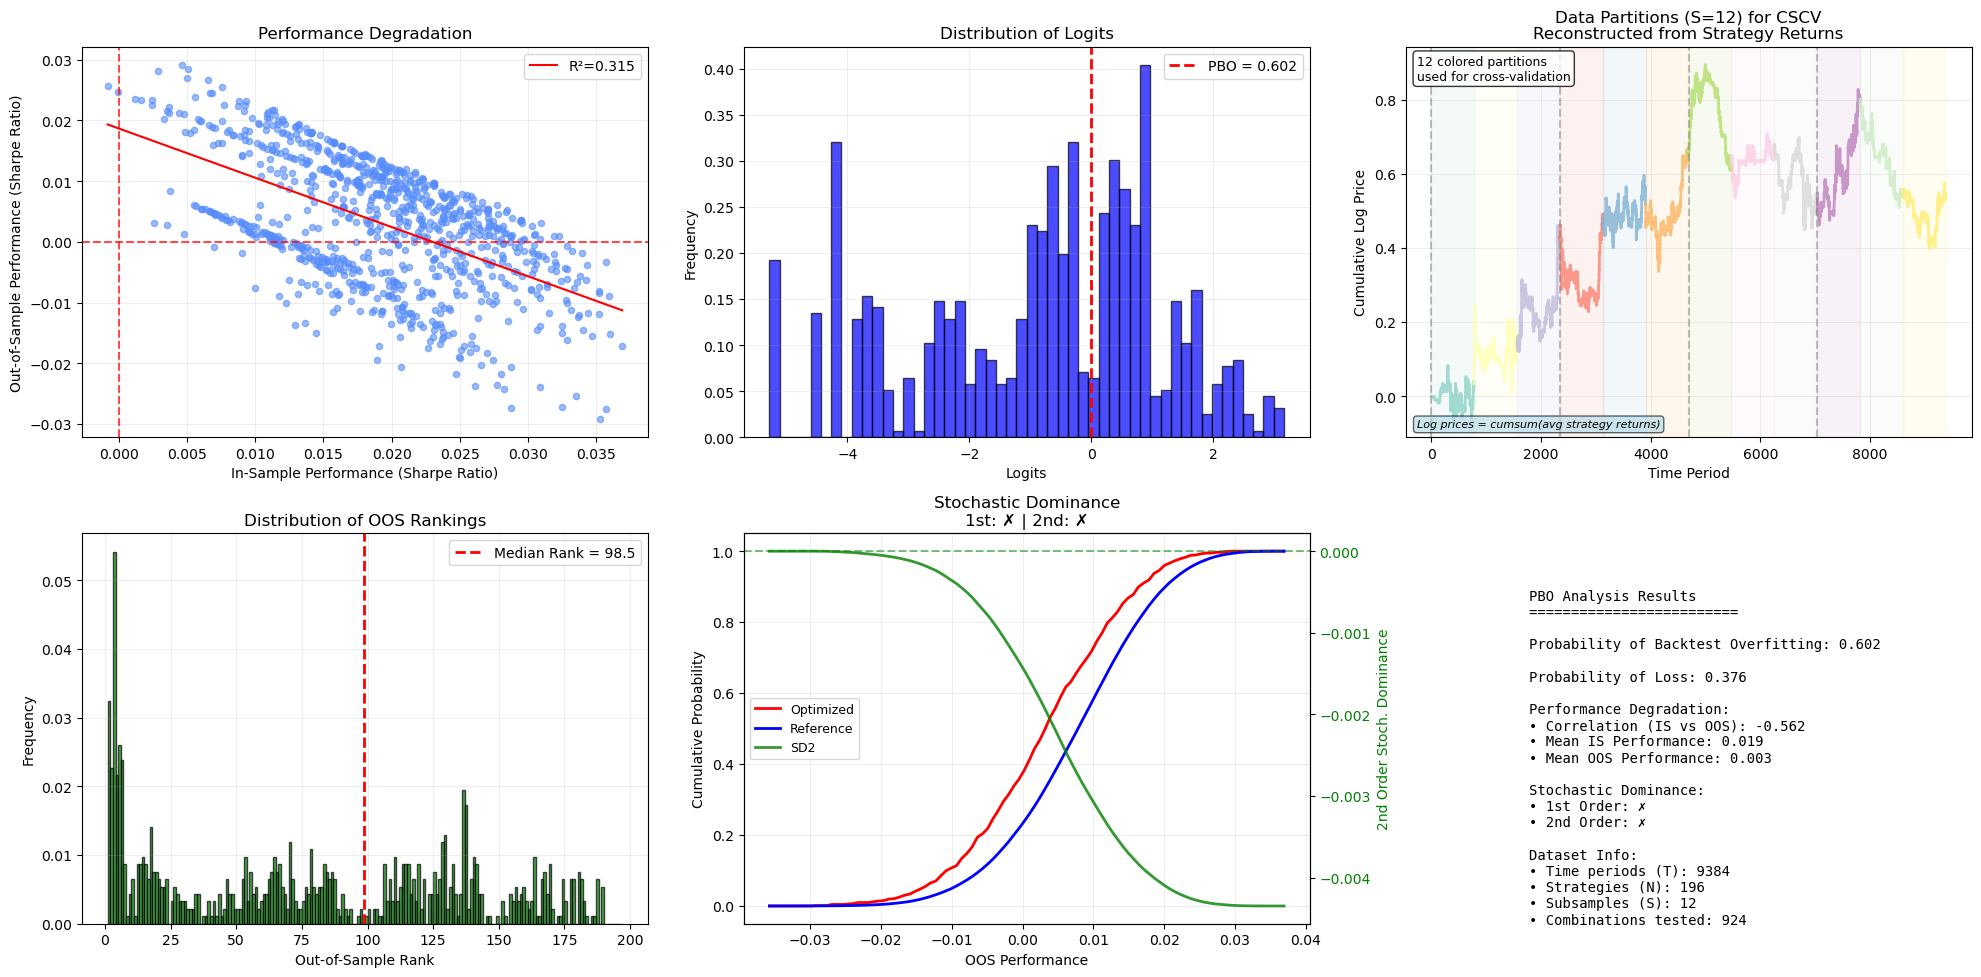
Example PBO output for a candidate rejected by the gate (PBO = 0.602, well above the 0.30 threshold). The negative IS↔OOS correlation (R² = 0.315, top-left), the heavy left tail in the logit distribution (top-middle), and the median OOS rank of 98.5 out of ~196 all point to the same diagnosis: in-sample winners systematically lose their edge out-of-sample. This is the failure mode the gate is specifically designed to catch.
Deflated Sharpe Ratio (DSR)
The DSR corrects the observed Sharpe for the number of independent trials run during optimization, removing the selection bias that would otherwise inflate apparent skill. For the stablecoin strategy reported below, the DSR calculator evaluated 196 total trials (37 independent), establishing a Sharpe threshold of 0.43 to clear the 95% significance bar; the best candidate’s Sharpe of 0.73 crossed it cleanly.
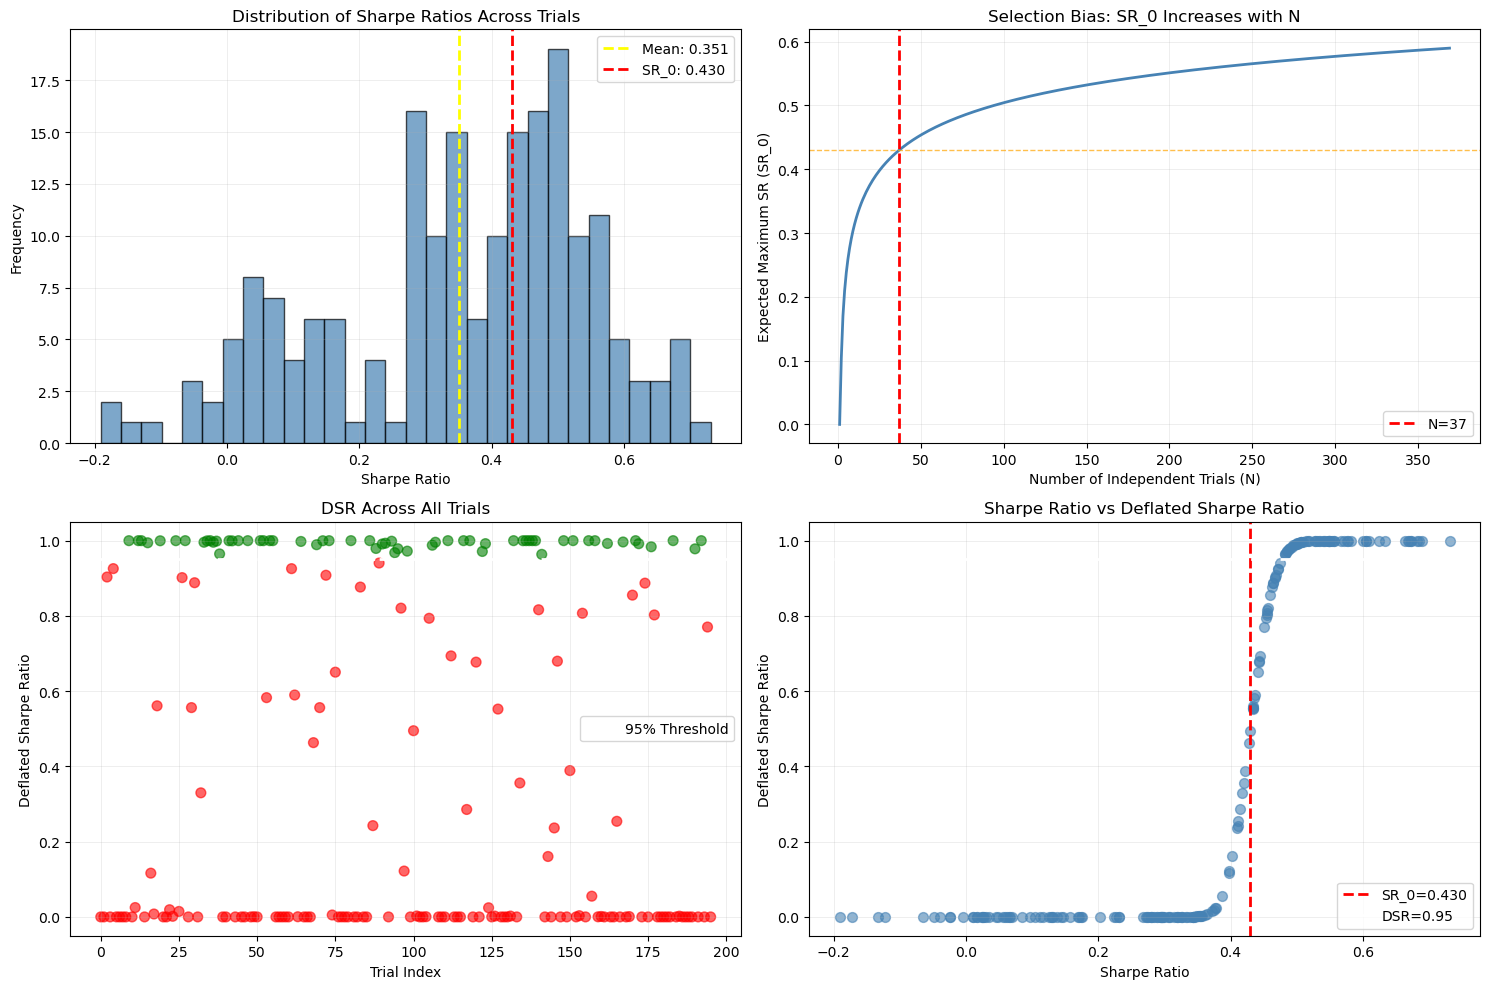
DSR for the stablecoin candidate. Top-left: distribution of in-sample Sharpe across 196 trials (mean 0.351, dashed yellow). Top-right: the expected-maximum Sharpe SR₀ as a function of the number of independent trials (N = 37 → SR₀ = 0.43, dashed red). Bottom-left: per-trial DSR; green = passes the 95% bar, red = fails. Bottom-right: the Sharpe→DSR mapping is a sigmoid that becomes meaningfully non-zero only above SR₀ = 0.43 — Sharpes lower than that are statistically indistinguishable from chance given the trial count.
Monte Carlo Permutation Test (MCPT)
The bar order is shuffled many times to test whether the strategy’s profit factor exceeds what is achievable on permuted, signal-free data. Unlike PBO, MCPT directly attacks the question “would a random trading rule on this data look this good?” A strategy that fails MCPT has no real edge over noise, regardless of how clean its equity curve looks.

MCPT for the stablecoin candidate. Left: the real strategy (red) versus 100 permuted (signal-free) versions of the same parameter set (grey). Right: distribution of profit factor across permutations, with the real strategy’s PF = 1.06 marked in red. P-value = 0.0099 — the real strategy outperforms 99.01% of permuted versions, which is exactly the kind of separation a genuine edge produces.
Out-of-sample performance
Sharpe and maximum drawdown are evaluated on a strict time-series hold-out segment never seen by the optimizer. This is the simplest test conceptually and the most consequential in practice — many candidates that pass PBO and MCPT still fail OOS because the underlying market regime has shifted.
A candidate is promoted to live only when all four checks pass simultaneously. The gate is intentionally aggressive — most candidates are rejected, which is the correct behavior in a regime where optimistic bias is the default failure mode.
Cost model
Backtests apply a 0.05% commission and 0.03% slippage per fill, with double cost on position flips (the simulator decomposes flips into a close followed by an open). All reported metrics are net of cost.
Walk-forward tracking
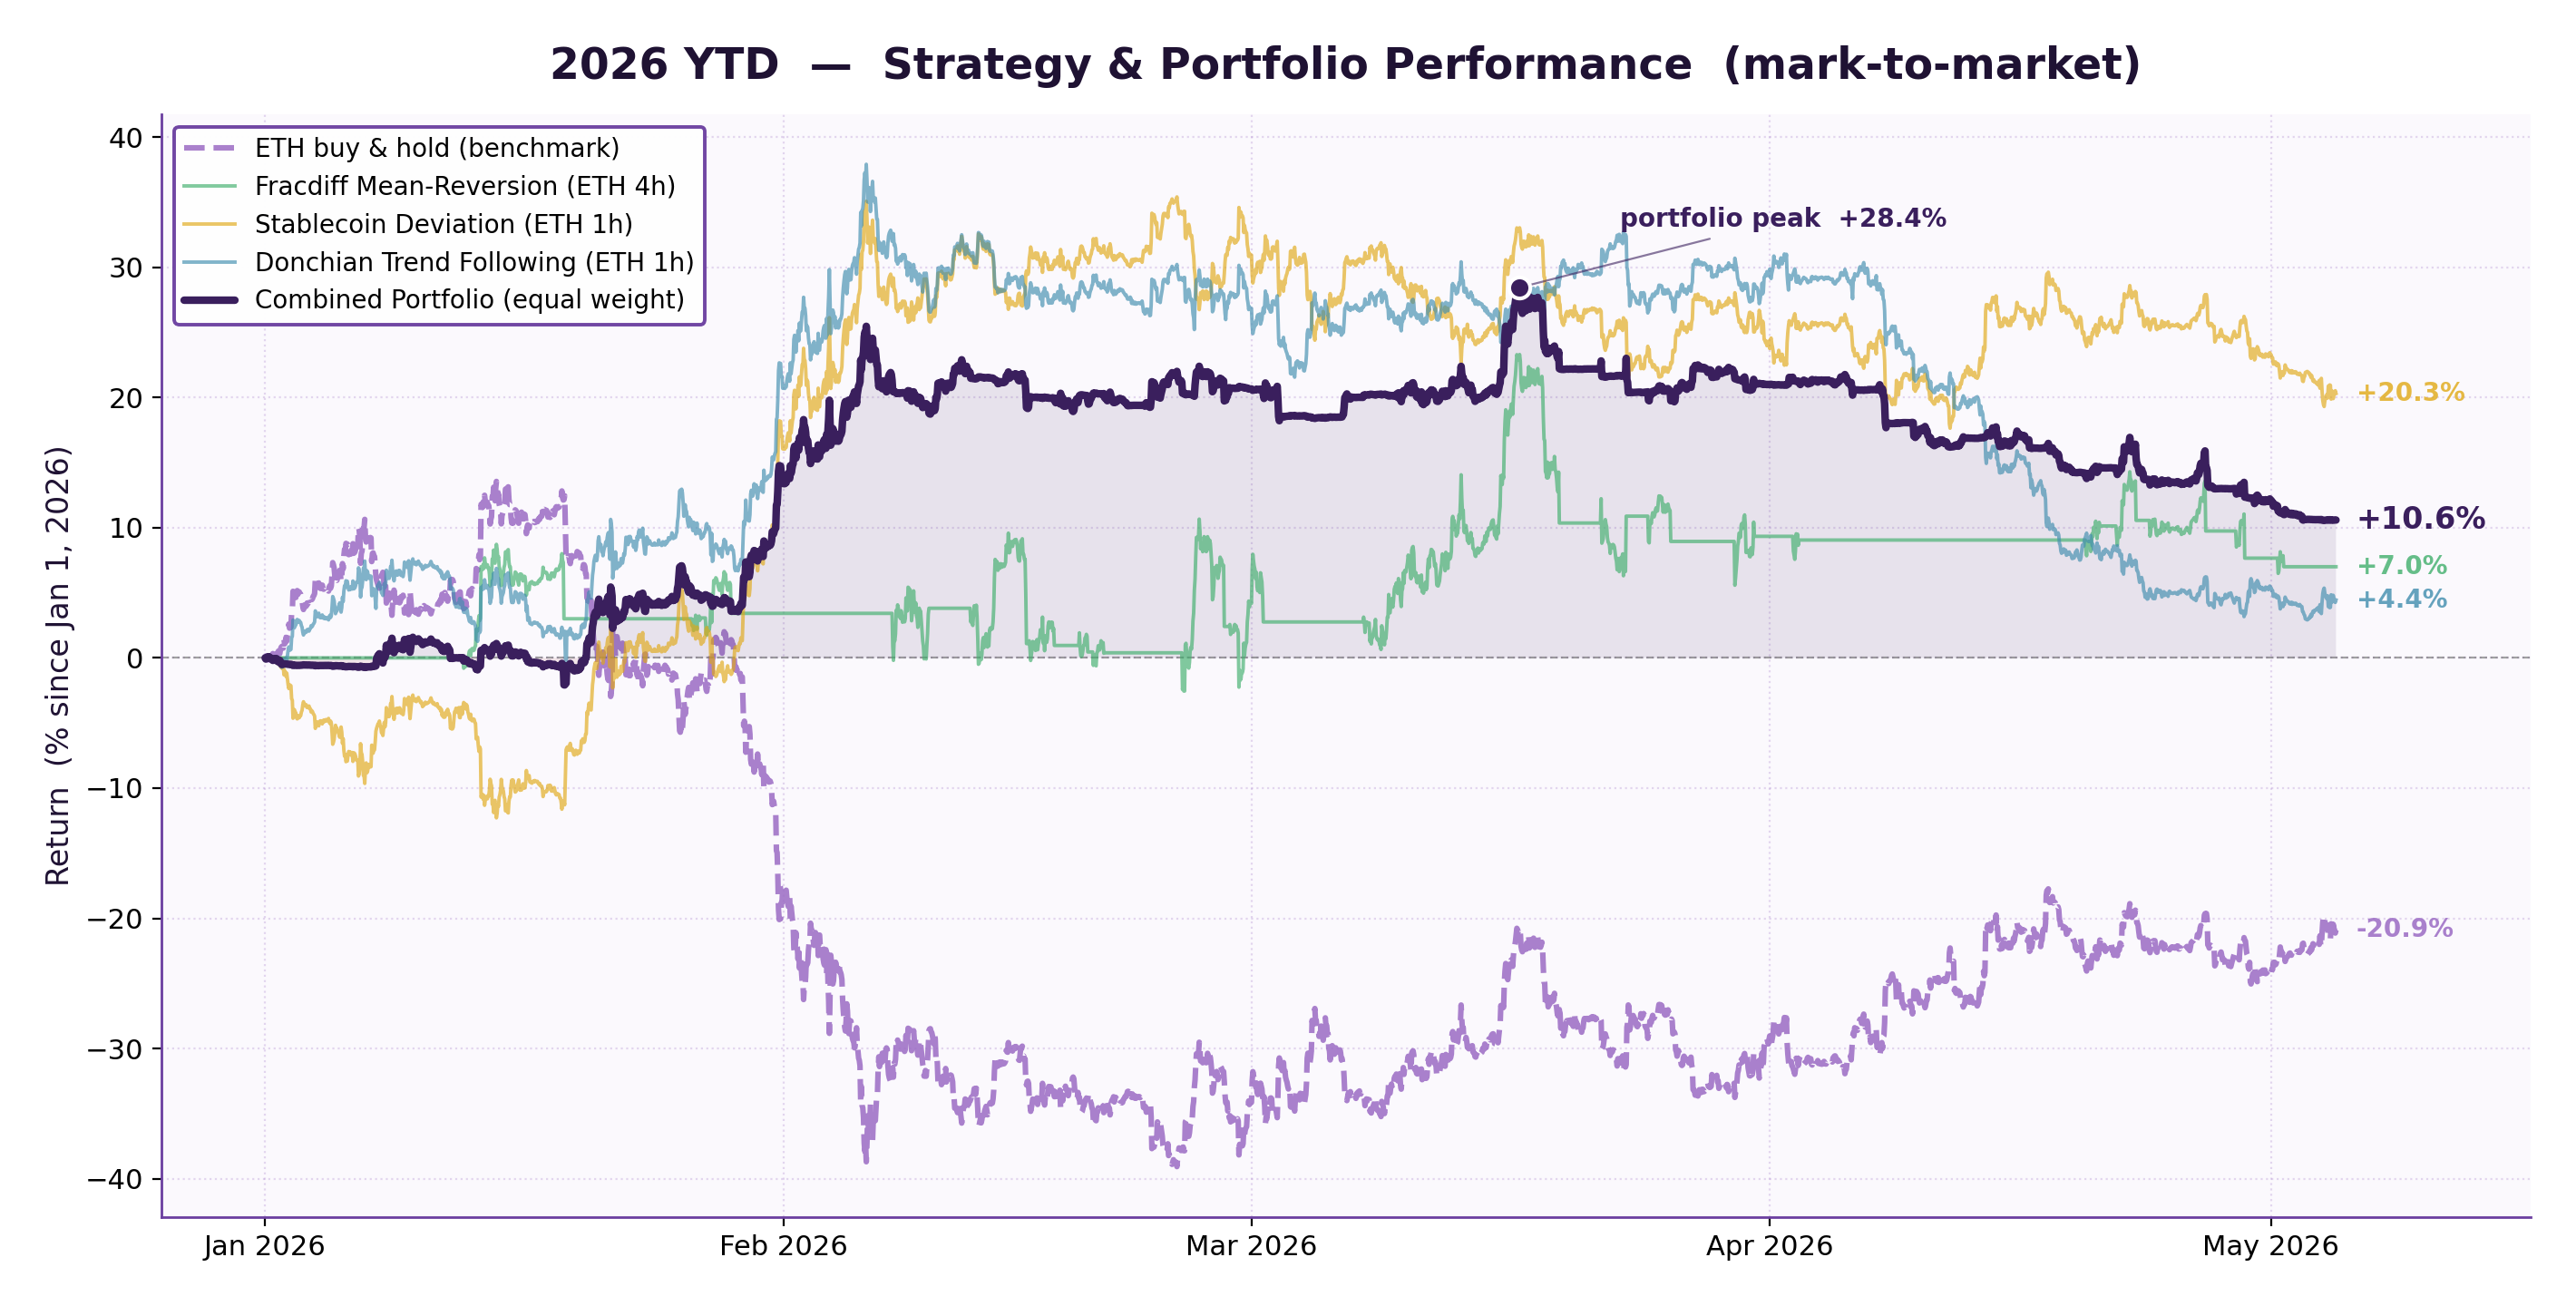
Three strategies cleared the validation gate and have been tracked in walk-forward evaluation since late 2025:
- Stablecoin Deviation (ETH 1h) — mean-reversion on transient ETH/USDT depegs at the venue level
- Fractional-Differencing Mean-Reversion (ETH 4h) — fracdiff preserves long memory while restoring stationarity, enabling reversion entries on residuals against an adaptive band
- Donchian Trend Following (ETH 1h) — channel breakout with ATR-based stops
| Strategy | Return | Max DD | Sharpe | Calmar | Win % | PF | Trades |
|---|---|---|---|---|---|---|---|
| Fracdiff Mean-Reversion (4h) | 7.00% | −17.72% | 0.47 | 0.40 | 51.7 | 1.58 | 42 |
| Stablecoin Deviation (1h) | 20.31% | −17.76% | 1.35 | 1.14 | 50.0 | 3.71 | 8 |
| Donchian Trend Following (1h) | 4.45% | −34.98% | 0.32 | 0.13 | 34.9 | 1.45 | 43 |
| Combined portfolio (eq. wt.) | 10.59% | −17.89% | 1.25 | 0.59 | — | — | 93 |
| ETH buy & hold (benchmark) | −20.90% | −52.62% | −1.26 | −0.40 | — | — | — |
The combined-portfolio walk-forward equity curve shows +10.6% YTD against an ETH benchmark of −20.9% over a quarter in which the underlying asset entered a sustained drawdown. The equal-weight combination materially reduced single-strategy variance: portfolio Sharpe of 1.25 exceeds any individual strategy’s Sharpe, and portfolio max drawdown is contained near the best of the three constituents rather than the worst.
The point of interest is not the headline number — a single quarter is too short for a confidence claim — but the shape: the tracked portfolio remained above its starting equity while ETH declined ~21%, which is the behavior the framework was designed to produce.
Demo
Conference poster
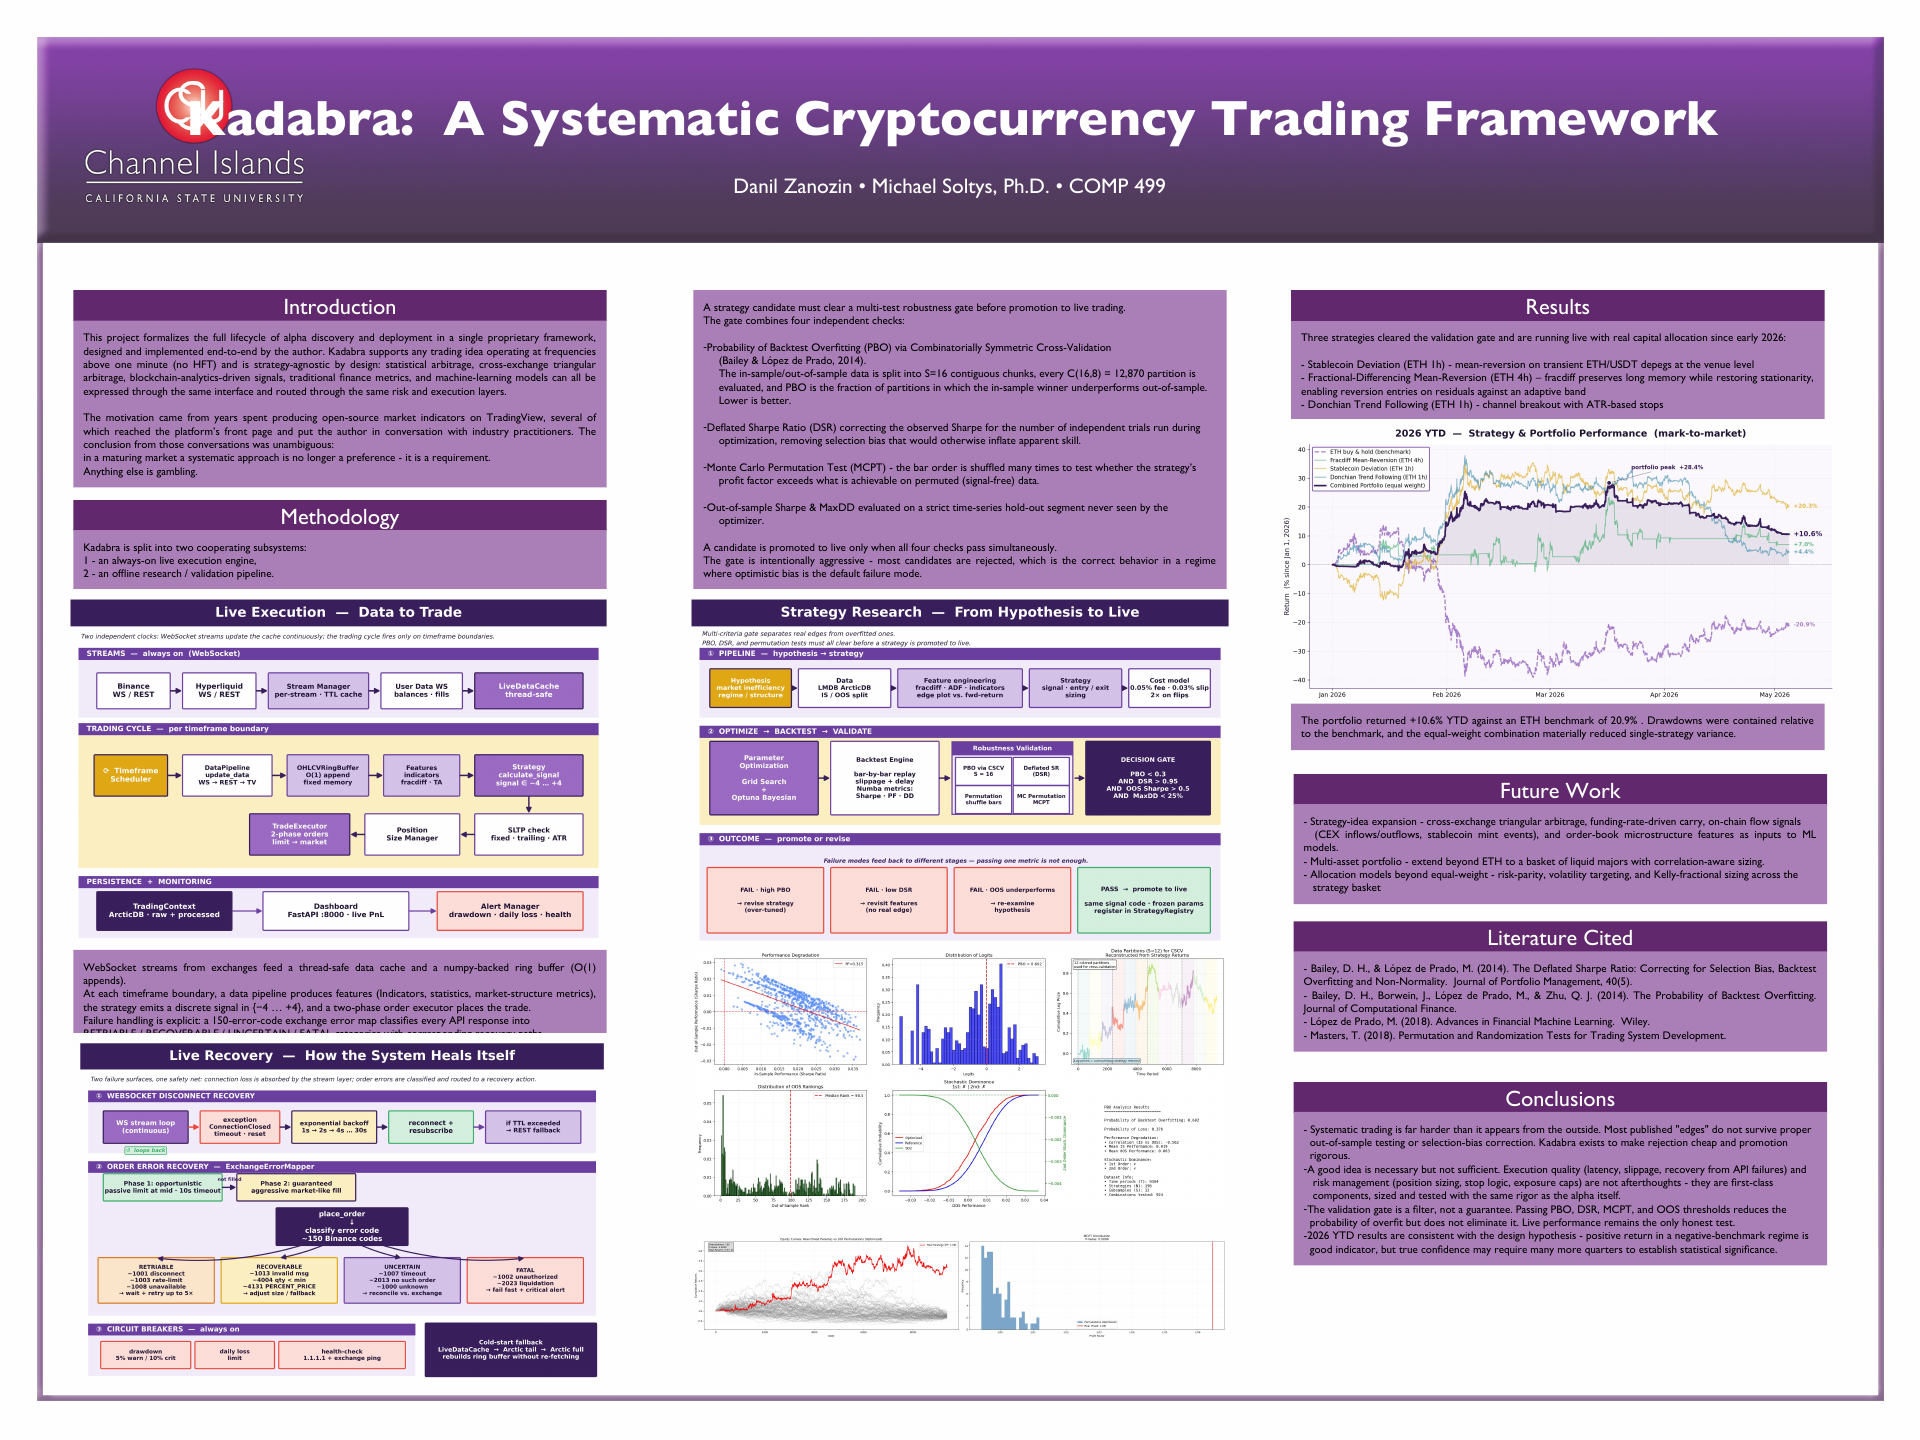
This project was presented at the Spring 2026 CSU Channel Islands Computer Science Capstone Showcase. The poster condenses the same material — abstract, architecture, validation methodology, and tracking results — into a single 36″ × 48″ print format. To stay legible at that size the poster uses simplified versions of the architecture diagrams; the detailed Mermaid renderings shown above are the authoritative versions.
Conclusions
- Systematic trading is far harder than it appears from the outside. Most published “edges” do not survive proper out-of-sample testing or selection-bias correction. Kadabra exists to make rejection cheap and promotion rigorous.
- A good idea is necessary but not sufficient. Execution quality (latency, slippage, recovery from API failures) and risk management (position sizing, stop logic, exposure caps) are not afterthoughts — they are first-class components, sized and tested with the same rigor as the alpha itself.
- The validation gate is a filter, not a guarantee. Passing PBO, DSR, MCPT, and OOS thresholds reduces the probability of overfit but does not eliminate it. Live performance remains the only honest test.
- 2026 YTD walk-forward results are consistent with the design hypothesis — but a single quarter is too short to establish statistical significance.
Future work
- Strategy expansion — cross-exchange triangular arbitrage, funding-rate carry, on-chain flow signals (CEX inflows/outflows, stablecoin mint events), and order-book microstructure features as inputs to ML models.
- Multi-asset portfolio — extend beyond ETH to a basket of liquid majors with correlation-aware sizing.
- Allocation models beyond equal-weight — risk-parity, volatility targeting, and Kelly-fractional sizing across the strategy basket.
- System hardening — co-located execution, redundant data feeds, formal verification of the order-state machine, and automated reconciliation against exchange ground truth.
References
- Bailey, D. H., & López de Prado, M. (2014). The Deflated Sharpe Ratio: Correcting for Selection Bias, Backtest Overfitting and Non-Normality. Journal of Portfolio Management, 40(5).
- Bailey, D. H., Borwein, J., López de Prado, M., & Zhu, Q. J. (2014). The Probability of Backtest Overfitting. Journal of Computational Finance.
- López de Prado, M. (2018). Advances in Financial Machine Learning. Wiley.
- Masters, T. (2018). Permutation and Randomization Tests for Trading System Development.
- Soltys, M. (2018). An Introduction to the Analysis of Algorithms. World Scientific.
Acknowledgements
The author thanks Dr. Michael Soltys for advising this project, and California State University Channel Islands Computer Science program for supporting independent capstone work.